
gis analytics with cmaptit
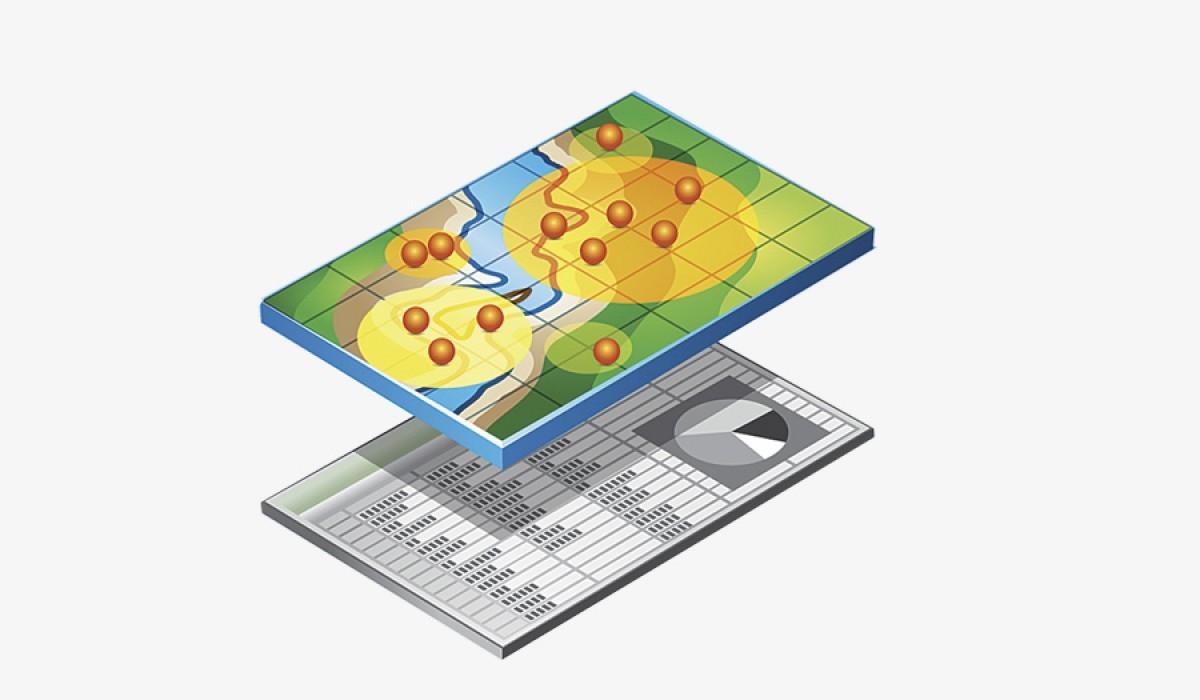
Learn to visualize and interact with data in few minutes, embed interactive maps, plot and analyze raster files, and other GIS analysis with cMapIT.
2 weeks
Program length
Intermediate
Skill level
3 modules
Curriculum phases
₦30,000
Payment options
- Pay in full
- Secure checkout
Prefer a custom payment plan? Ask admissions on WhatsApp
Studio note
“The application of GIS is limited only by the imagination of those who use it”.Jack Dangermond, Esri
How you’ll learn
- Online
Payment options
- Pay in full
Type
program
Outcomes
What you will master
Learn to visualize over 100
Plot and analyze raster files
Easily extract the plots to your research reports
Generate your own map editor in minutes (a template) that you can use offline
Export interactive map with all the editor features
Run virtual survey with your field team
Collaborate with cMapIT cloud data storage and share datasets in real time and more
About this track
Welcome to a simplified GIS terminal and data services platform – cMapIT. Search for arable land, measure, document and analyze. Create map editor, measure land area and plot raster with cMapIT software, a very seamless and functional GIS platform.
Prerequisites
What you need before you start
Interest in Geographic Information System...
- You should be able to write and communicate in English
- Have an interest in Geographic Information System
- Desire to develop, enhance your data analysis skills
- An internet enabling device.
Curriculum breakdown
Module outline
Phase 1: Introduction to GIS and cMapIT GIS analytics +
cMapIT GIS analytics tool is designed for non GIS experts and non techies interested in working with GIS technology to enhance their productivity, share reports, embed interactive maps, build important datasets from maps and more.
Phase 2: CREATE MAP EDITOR +
Learn to visualize over 100,000 data points or Less, generate your own map editor in minutes (a template) that you can use offline. Designed for professionals on the move.
Milestone: COVID 19 Spread Mapping
The Nigerian government have asked you as a consultant to map out the spread of covid 19 in Nigeria, you are to generate an interactive map that can also be shared with every public health worker to help them measure the distance between clusters of confirmed cases of covid 19 in Nigeria, where we have the most affected citizens and the pace of spread. Team B will curate the mock dataset of covid19 spread in Nigeria and generate this into an interactive map capable of measuring the spread and the pace of the spread of covid19 in Nigeria.
Phase 3: MEASURE LAND AREA +
This is designed for urban planners, environmentalists, real estate firms and the application is also very useful to NGOs and CSOs for virtual surveys. This will also help real estate managers and agents in asset valuation, remotely.
Milestone: Diageo Farm Database
The Nigerian government have asked you as a consultant to map out the spread of covid 19 in Nigeria, you are to generate an interactive map that can also be shared with every public health worker to help them measure the distance between clusters of confirmed cases of covid 19 in Nigeria, where we have the most affected citizens and the pace of spread. Team B will curate the mock dataset of covid19 spread in Nigeria and generate this into an interactive map capable of measuring the spread and the pace of the spread of covid19 in Nigeria.
Want the full week-by-week lesson breakdown?
We’ll email the syllabus PDF — no website download.
Ready for gis analytics with cmaptit?
Confirm your seat and pay via secure checkout.
How you’ll learn
- Online
Payment
- Pay in full
₦30,000
₦30,000
2 weeks · Online